How to Prove an SLA Violation Using Shareable Latency Reports
You have a hunch your vendor, upstream API, or cloud provider missed their SLA. Response times were elevated for hours. Users complained. But when you raise it, the response is a shrug and a request for "evidence."
A screenshot of your browser's network tab does not hold up. What you need is a timestamped, reproducible record of exactly how the service performed over time — broken down by phase, not just total response time. This guide walks you through how to set that up with Latency Test and generate a shareable report you can send to anyone, no login required.
Step 1: Create a Monitor
Head to your dashboard and create a new project. Give it a name that reflects the service you are monitoring — for example, "Payments API" or "Vendor Auth Endpoint."
Add the URL you want to monitor. If the endpoint requires authentication or a specific request body, you can configure custom headers and select the appropriate HTTP method (GET, POST, PUT, etc.). Once saved, Latency Test will begin sending synthetic requests to your endpoint at the interval you specify — as frequently as every minute.
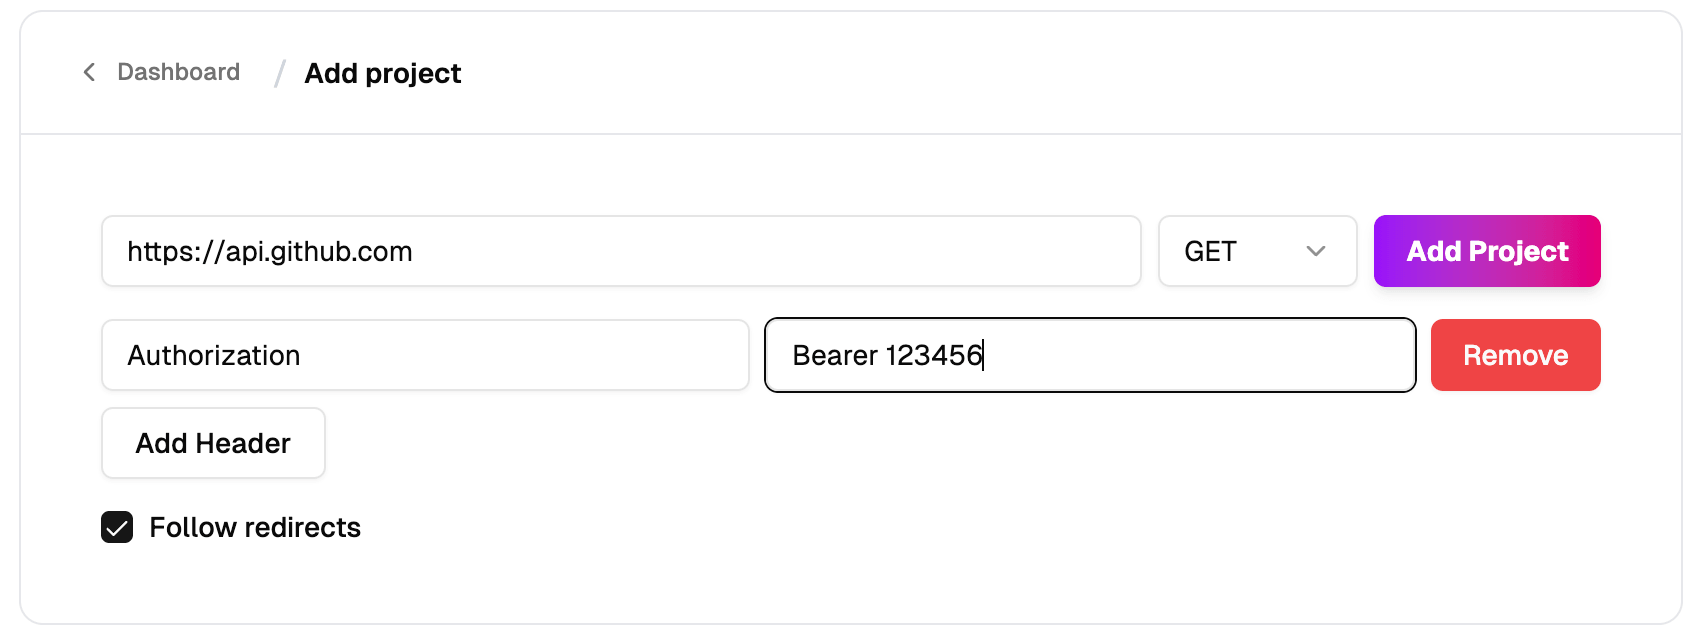
If you are responding to an incident that is already in progress, create the monitor immediately. The sooner it starts collecting data, the more evidence you will have. If you are being proactive before an SLA issue occurs, a shorter check interval (one or two minutes) gives you finer-grained data during any future incidents.
Step 2: Understand What Gets Measured
Latency Test breaks every HTTP request into five distinct phases:
- DNS Lookup — time to resolve the domain name to an IP address
- TCP Connection — time to establish the network connection to the server
- TLS Handshake — time to negotiate the secure connection (HTTPS only)
- Server Processing (TTFB) — time from the first byte sent to the first byte received; this is where your vendor's backend performance lives
- Content Transfer — time to download the response body
When it comes to proving an SLA violation, Server Processing (TTFB) is typically the most important phase. DNS and TCP times are influenced by your network, not the vendor's servers. TTFB, on the other hand, is entirely on the vendor's side — it reflects how long their infrastructure took to respond after receiving your request.
If your SLA states a maximum response time of 500ms, and TTFB alone is consistently hitting 600ms, that is a clear, phase-specific violation you can point to directly.
Step 3: Identify the Violation Window
Once your monitor has been running, open the metrics dashboard for your project. You will see latency charts over time for each phase, alongside error rate data.
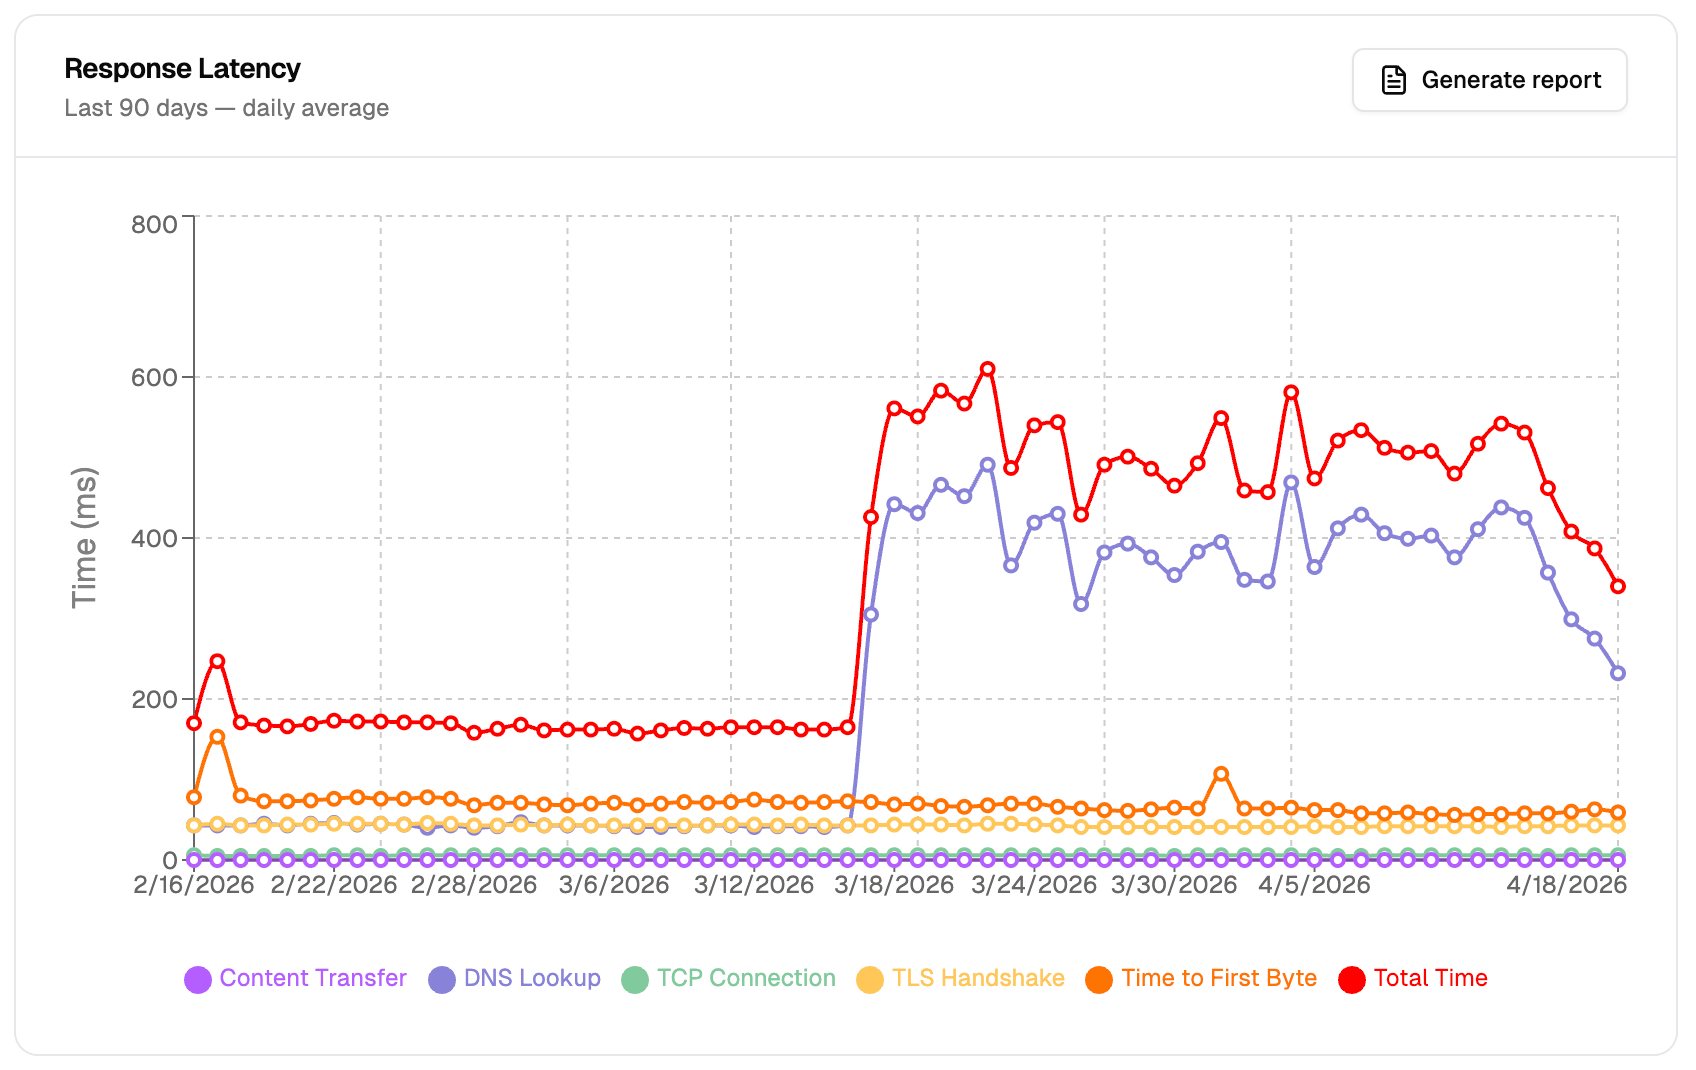
Look for two things:
- Latency spikes — any period where response times exceed your agreed SLA threshold. Pay attention to whether the spike is isolated to TTFB (vendor-side) or spread across all phases (which could indicate a network issue on your end).
- Error rate increases — 5xx responses, timeouts, or connection failures during the same window. Even if latency looks acceptable, elevated error rates are a separate SLA dimension that many agreements cover.
Note the exact timestamps of the start and end of the degraded period. You will reference these when sharing the report.
Step 4: Generate a Shareable Report
From your project dashboard, open the Reports section and select the time window that covers the incident: 24 hours, 7 days, 30 days, or 90 days. Choose the window that best captures both the degraded period and enough baseline data before it so the comparison is clear.
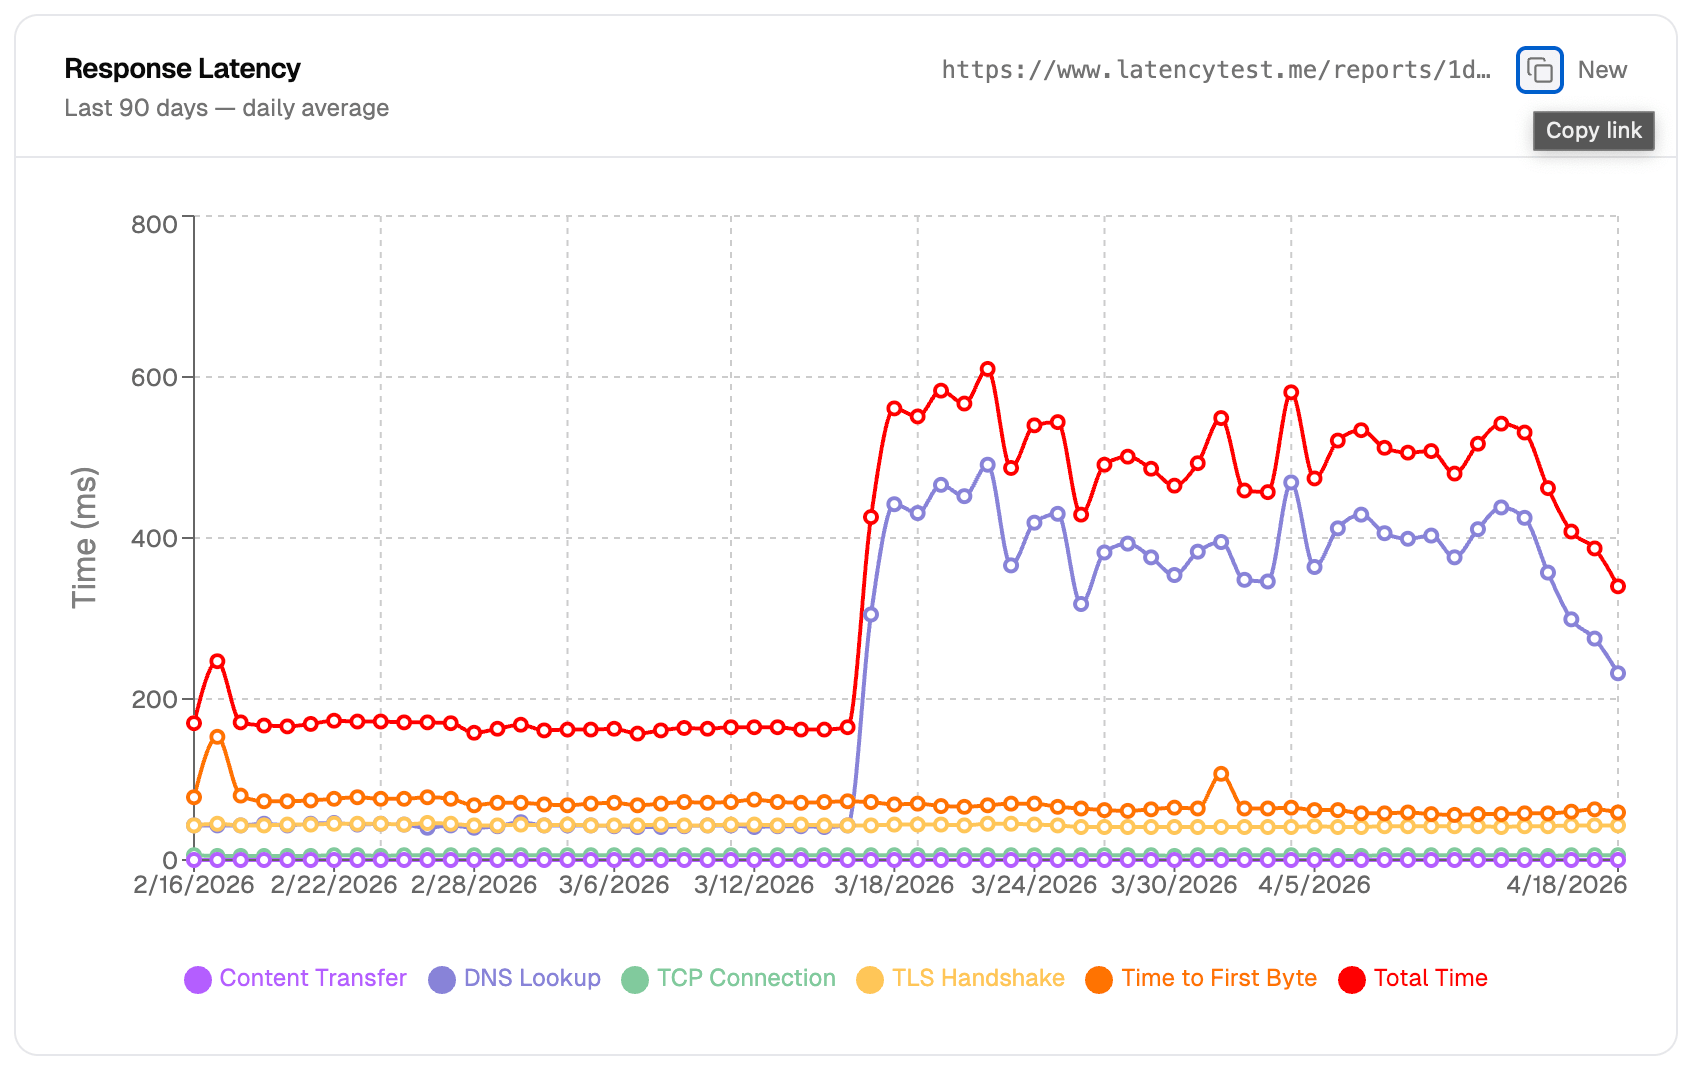
Click Generate Report. Latency Test creates a permanent public link to a read-only view of your performance data. The recipient does not need an account or login — they just open the link.
This is the link you will send to your vendor, your manager, or your client. It is not a screenshot; it is a live data view with timestamps, so there is no ambiguity about when measurements were taken.
Step 5: Interpret the Report Data
Before you send the report, make sure you understand what it shows so you can explain it clearly. The report surface three key data points for each phase:
- p50 (median) — half of requests were faster than this. Use this to describe "normal" behavior.
- p95 — 95% of requests were faster than this. SLAs are often written against p95 or p99, so this is frequently the number to compare against the agreement.
- p99 — only 1% of requests were slower than this. Useful for capturing the worst-case experience your users had.
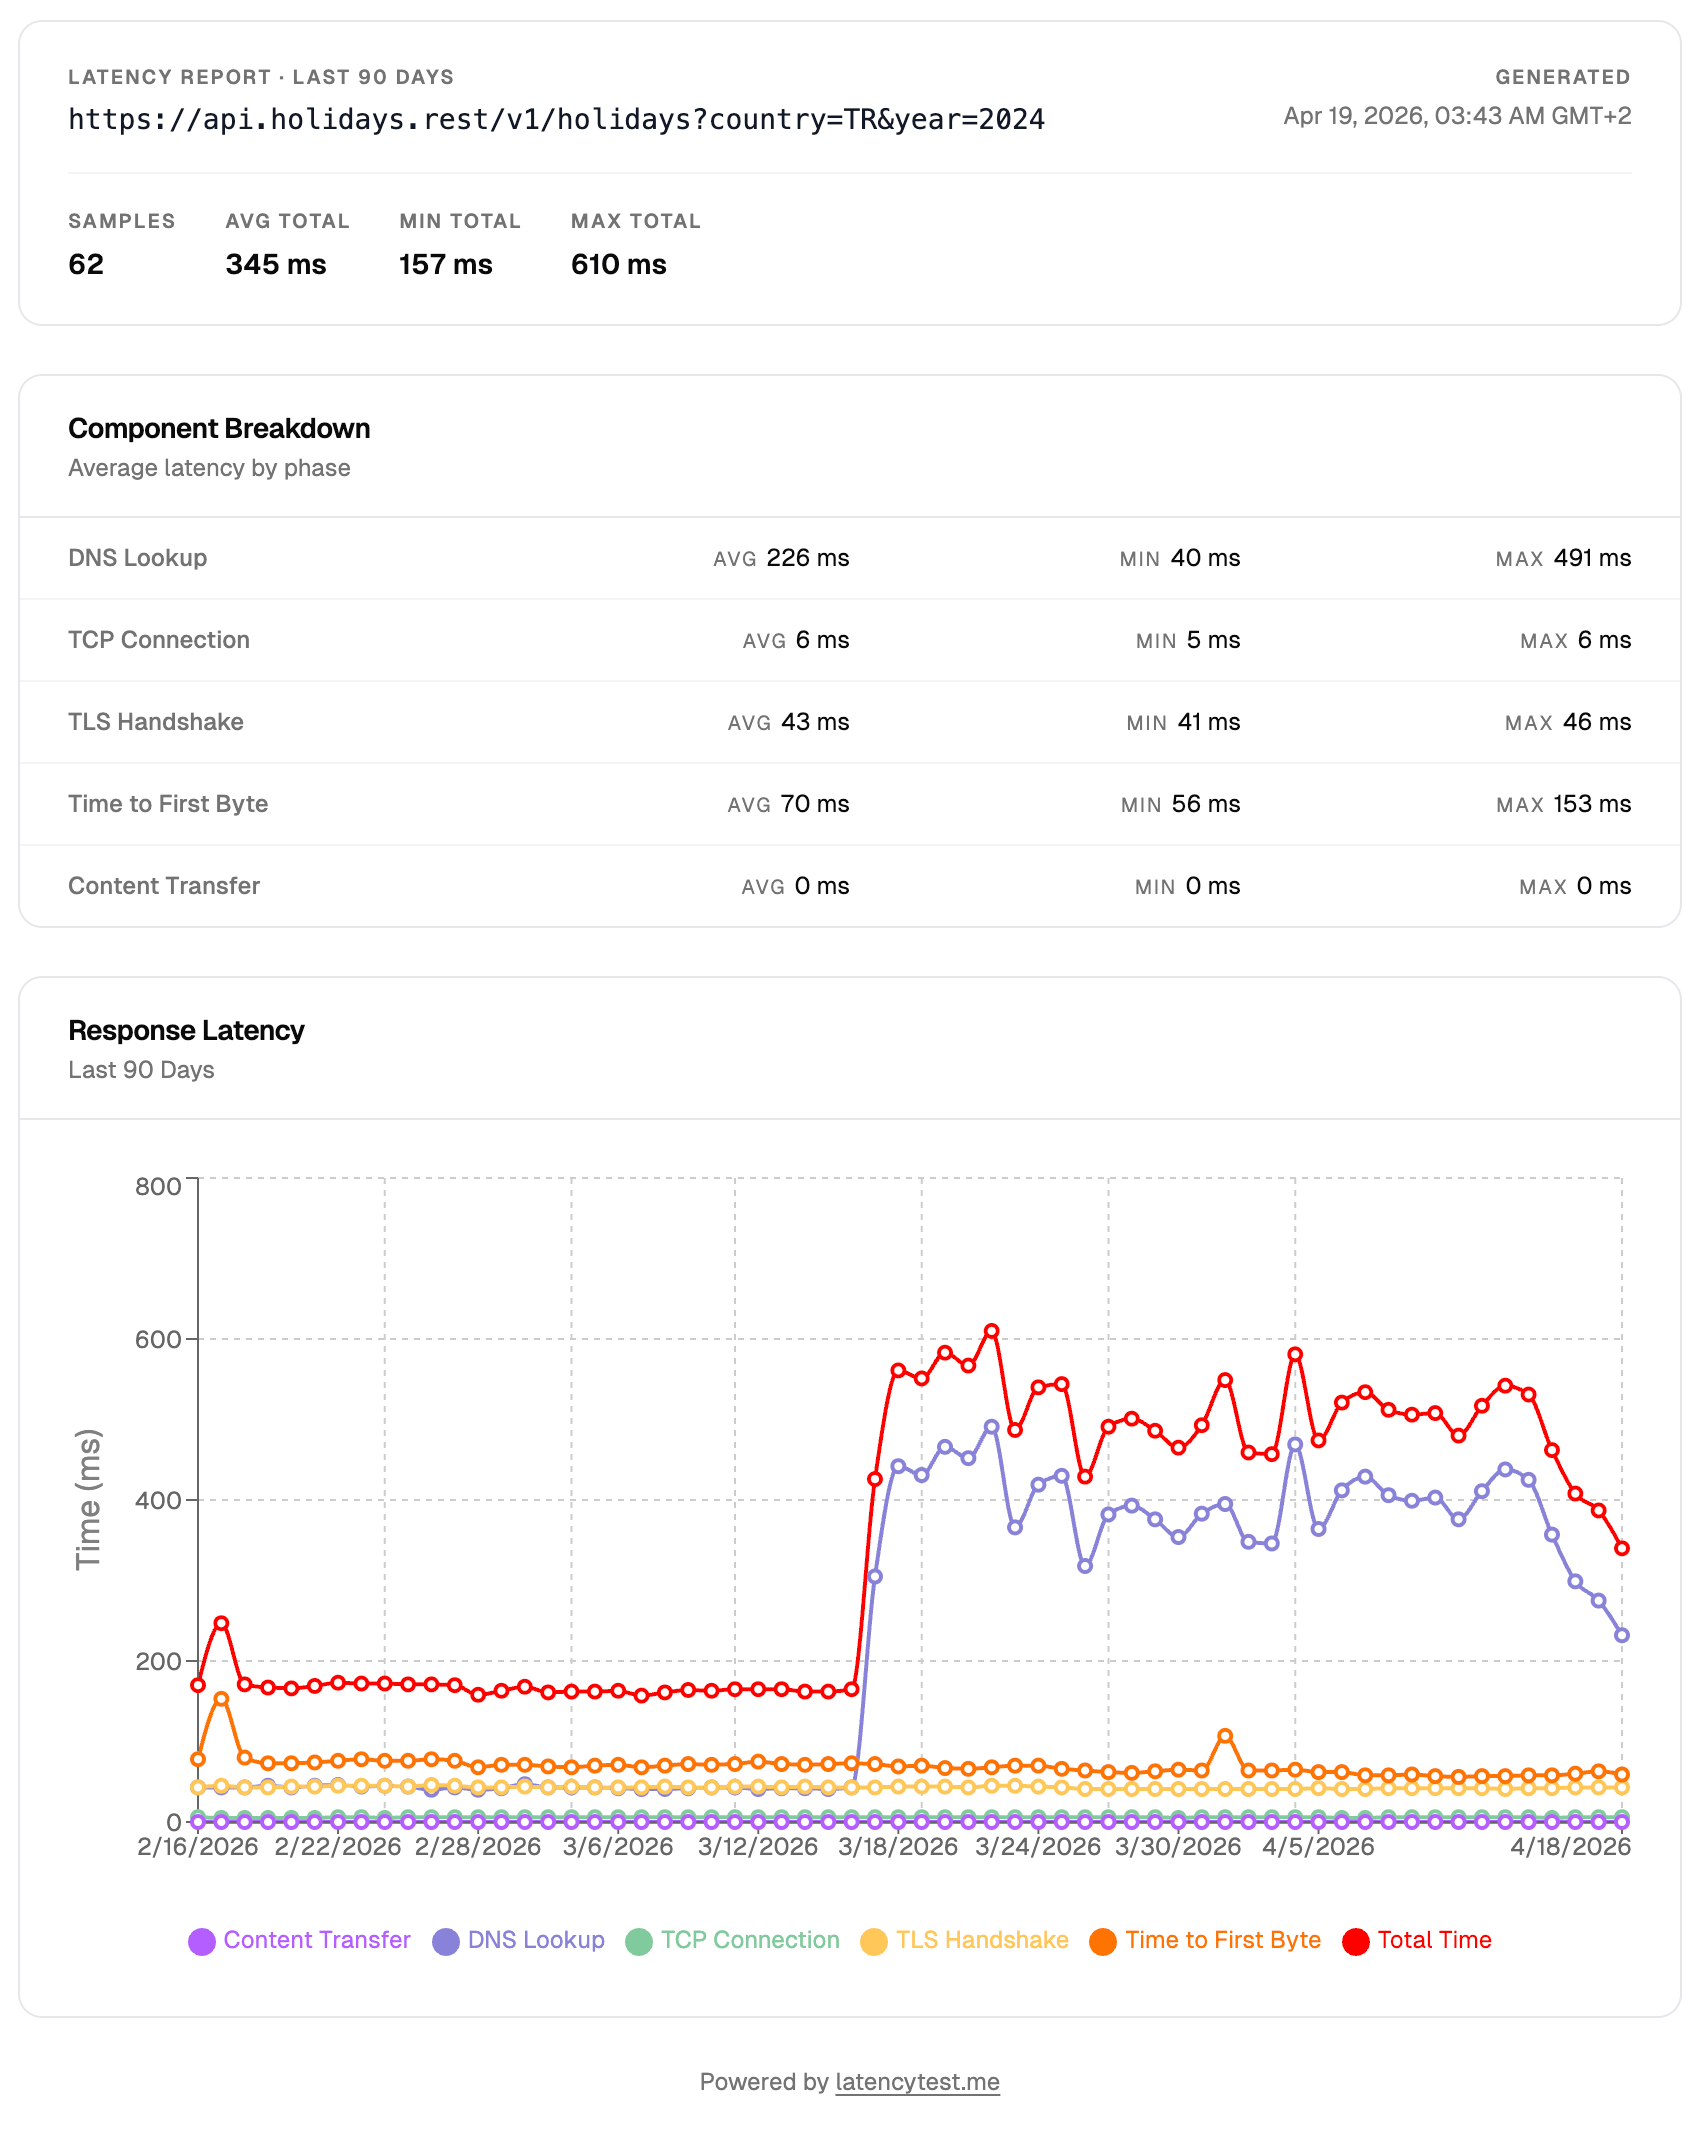
When presenting your case, lead with p95 or p99 TTFB during the incident window, then contrast it with the baseline p95 from the period immediately before the incident. A vendor response time of 1,200ms p95 during an incident versus 180ms p95 the day before is difficult to argue with.
If the report also shows elevated error rates during the same window — for example, a 4% rate of 5xx responses during a period when your SLA guarantees 99.9% availability — include that too. Error rate and latency together paint a complete picture of the breach.
Step 6: Share the Report
Send the report link along with a short message that anchors the reader to the key numbers. Do not make them hunt for the violation — point to it directly.
Here is a template you can adapt for a vendor conversation:
Hi [Name], we observed significant performance degradation on your [service name] endpoint between [start time] and [end time] on [date]. During this window, our synthetic monitoring recorded a p95 TTFB of [X]ms — well above the [Y]ms threshold in our agreement. The error rate also reached [Z]% during the same period. I have attached a shareable report with the full data: [link]. Let us know how you would like to proceed.
For internal escalations — for example, presenting to your engineering manager or an on-call lead — the same report works. Swap the vendor language for internal context and highlight what the impact was on your users or downstream services.
Wrapping Up
The difference between "we think the vendor was slow" and "here is a timestamped, per-phase breakdown showing their TTFB exceeded SLA thresholds for three hours" is the difference between a shrug and a resolution. Continuous monitoring gives you that data automatically, so the next time an incident happens, you are not scrambling to reconstruct what occurred from memory or log snippets.
Set up a monitor before you need it. When an SLA dispute comes up — and it will — the evidence is already there, waiting to be turned into a report and shared in seconds.