The four golden signals of observability
The four golden signals of observability consist of latency, traffic, errors, and saturation. In this post, we will go through each and explain the importance of them for your applications. Using the Latency Test, you can easily cover the two most important observability signals, latency and errors, in seconds and without having to pay a fortune.
Latency
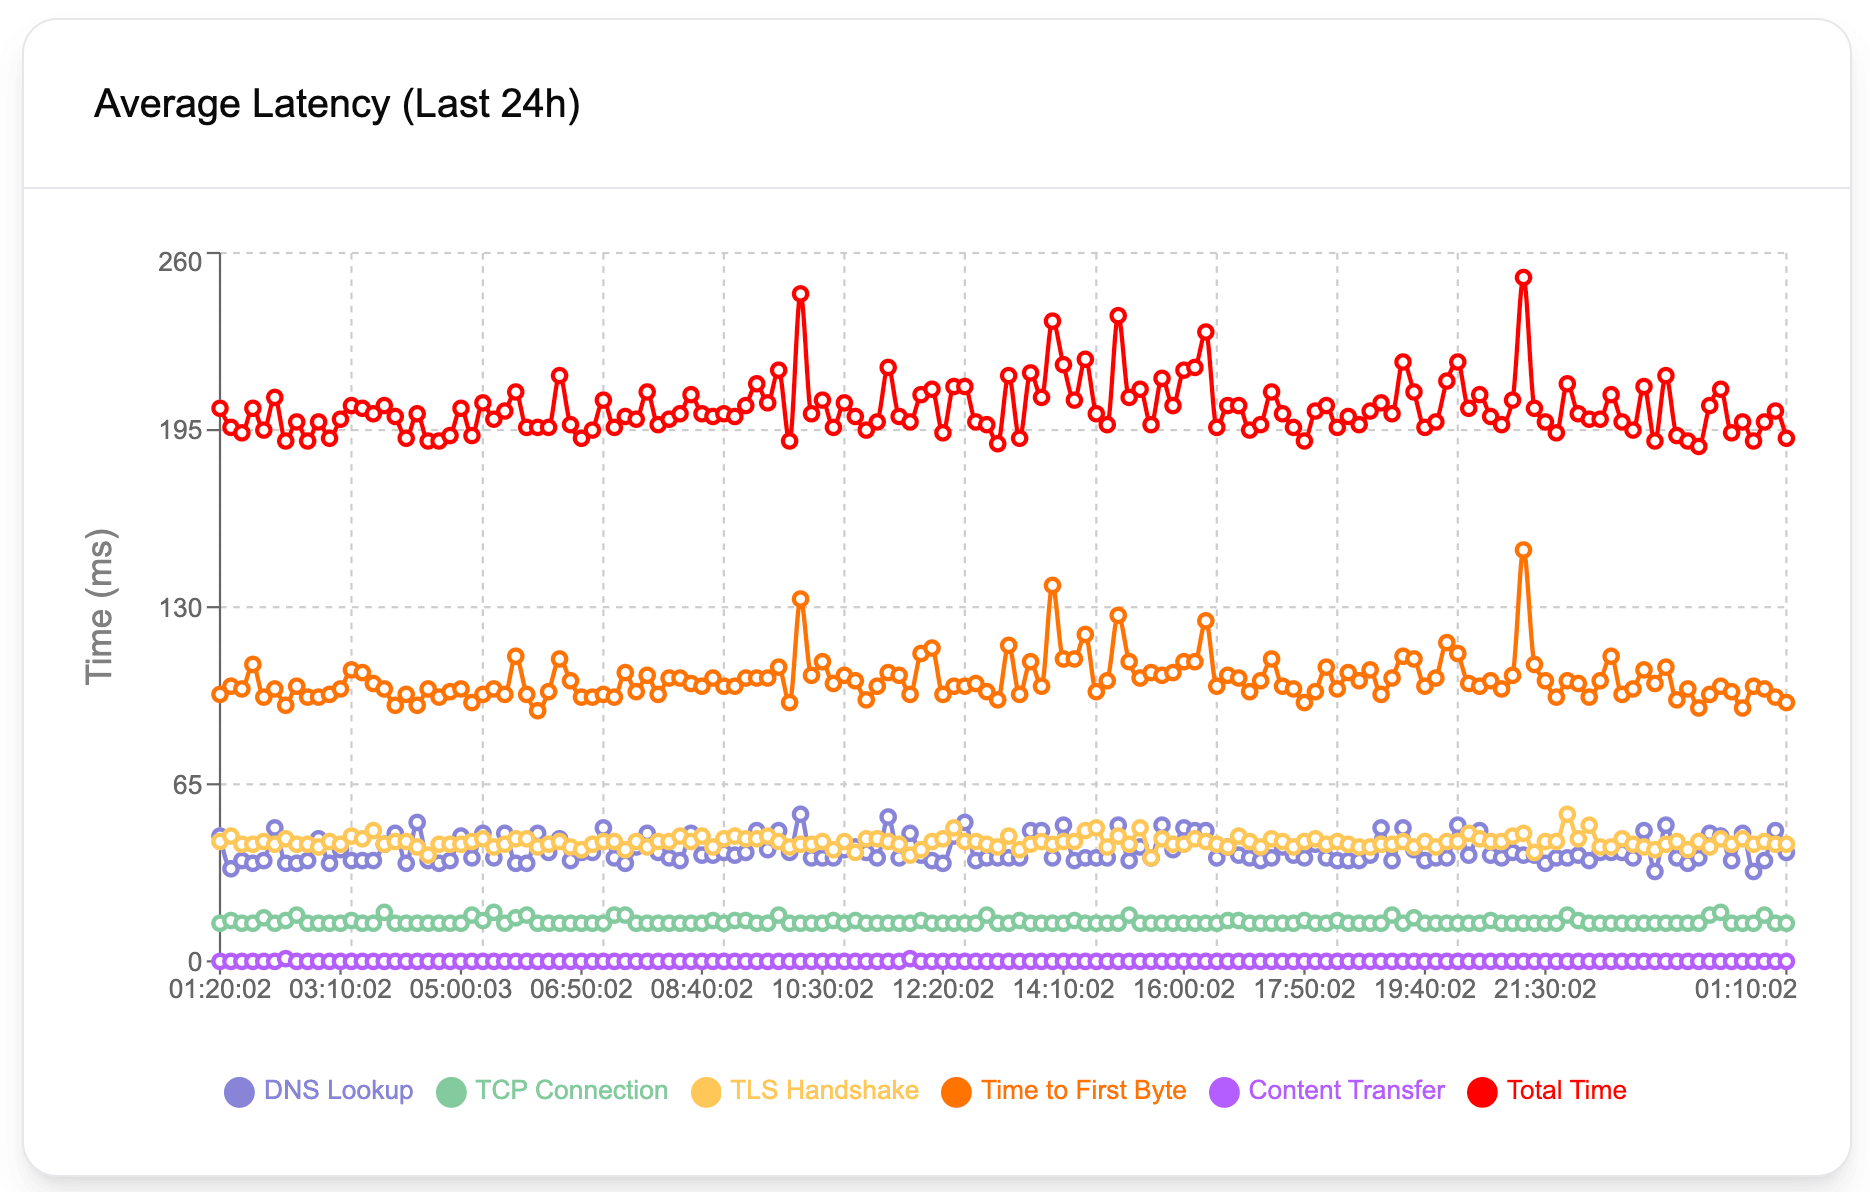
Latency in simple terms, is the time an operation takes. For web applications and APIs, it's typically measured in milliseconds. In the context of the web, latency can be described as the duration between a request and a response. Let's imagine, a customer enters the URL of your API, or website, and then hits enter. Latency is the time it takes until the customer obtains the data they want to obtain.
An HTTP request goes through many stages, such as DNS lookup, establishing a TCP connection, attempting a TLS handshake, and finally the content transfer. As a result of various issues, each of these stages can take longer than they should. For example, a slow DNS server will cause slow DNS lookup, or in other words, high DNS lookup values. Geographical distance between the server and the client (the customer, the party requesting data), typically increases TCP connection and content transfer durations. Underlying issues with SSL certificates and servers may cause increased TLS handshake times. Therefore, it's crucial to have a detailed breakdown of these latency values to pinpoint the exact reason behind performance issues. Latency Test helps you obtain all latency values in detail so that you can easily narrow down your investigation and pinpoint issues.
Findings from a latency analysis can tell a lot about the root cause of performance problems, even though it can't always tell the full story. For example, a high content transfer latency might be due to geographical distance, poor server performance, unoptimized database queries, and so on. However, it can help narrow down potential causes behind the performance issues.
Latency average is also typically used as part of synthetic API testing, a testing method to tell about the overall health of an application. When conducting these kinds of tests, it's almost mandatory to keep an eye on latency values and how they change over time as your application changes.
Errors
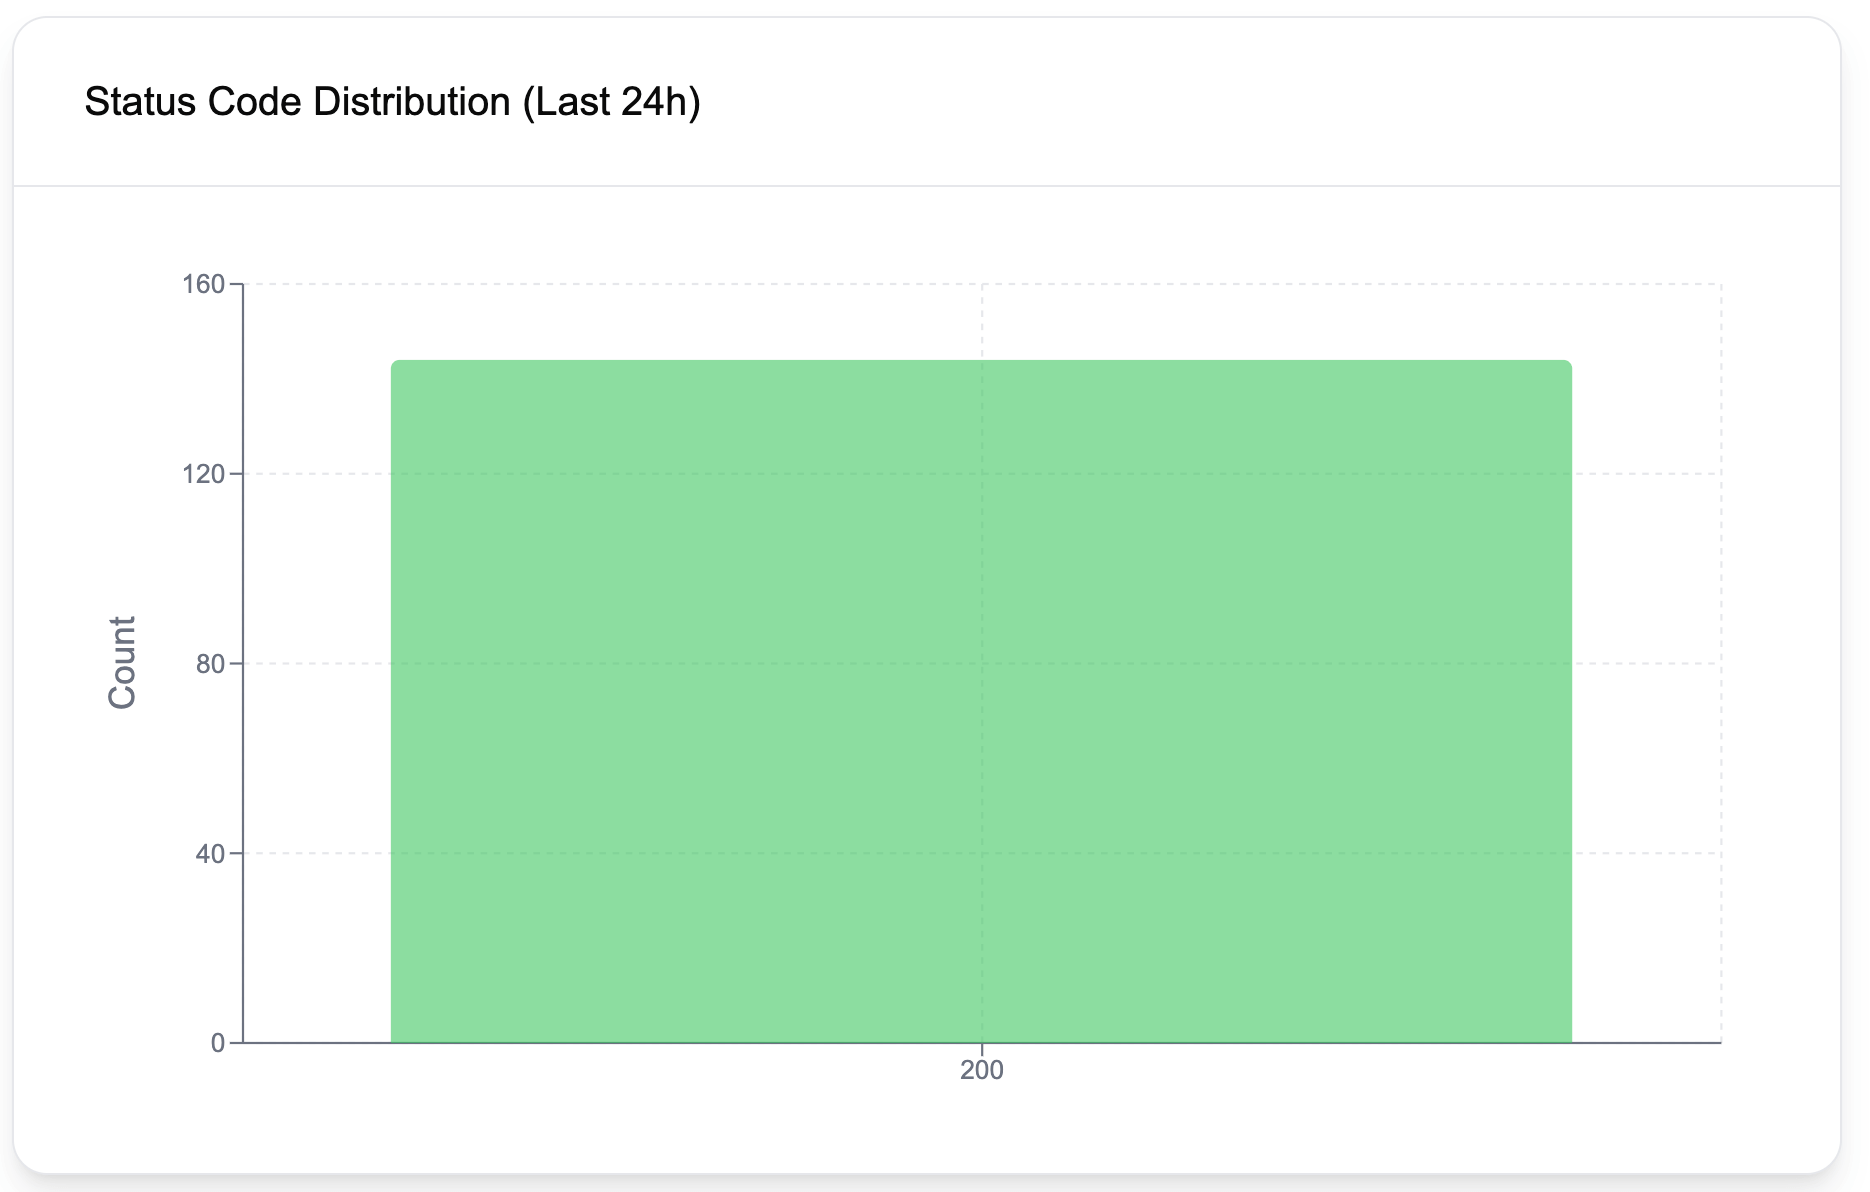
The error rate is a great indicator of application health and contributes a ton to observability. Ideally, for websites, we expect error rates to be very low. For APIs on the other hand, and especially if your customers directly interact with the API, as the customers may send faulty requests and get 4xx errors, observing some errors can still be considered healthy. Of course, the error threshold and what's acceptable and what's not depends on the nature of the API, and if your customers directly engage with it.
Errors are typically tracked using percentages as the number of errors is likely to go up as the traffic increases. For example, one can create alerts if the error rate exceeds 0.5%, after observing the application behavior for some time and deciding on a healthy threshold.
One other way of looking at errors is by evaluating consecutive errors. In this model, the observability pattern is created to track back-to-back errors and create alerts based on a certain metric. Using the Latency Test, you can set up alerts for consecutive errors in less than 30 seconds. This kind of alert informs you as soon as an issue starts to occur so that you can rapidly take action.
Traffic
Traffic is the number of requests your application gets. Since traffic often shows seasonality depending on the time of the day, it's important not to evaluate it alone, but instead compare it with the past day, or a week ago and look at the pattern disparities. For example, let's say you have a restaurant website and your website is typically visited around 5 pm and 6 pm as people order their dinners online. Over some time, you will have an understanding of how many visitors visit your website daily during these peak times. If this value suddenly drops by 50% one day, it may be worth looking at your applications and servers to see if there are any issues.
Saturation
Saturation is an early indicator of how likely issues are to happen in the future if the same resource consumption continues. For example, let's say your disk capacity decreases by 1% every day and the disk is already 15% full today. A quick math tells us, you will have only 85 days until your disk gets full. Another example could be a web application leaking memory and causing memory consumption to increase constantly. If the increase in memory consumption constantly increases, you will likely have no memory available sooner or later.
Observing saturation is crucial to get alerted of these issues before they happen. One might set up an alert to get notified if the memory usage exceeds 40%, or if the disk gets full more than 50%. It's always a good idea to leave some buffer between these thresholds and your estimation of when an issue may occur so that you can have enough time to intervene in the system. In other words, don't wait until the disk gets 90% full as you will have very little time until you can add more capacity.